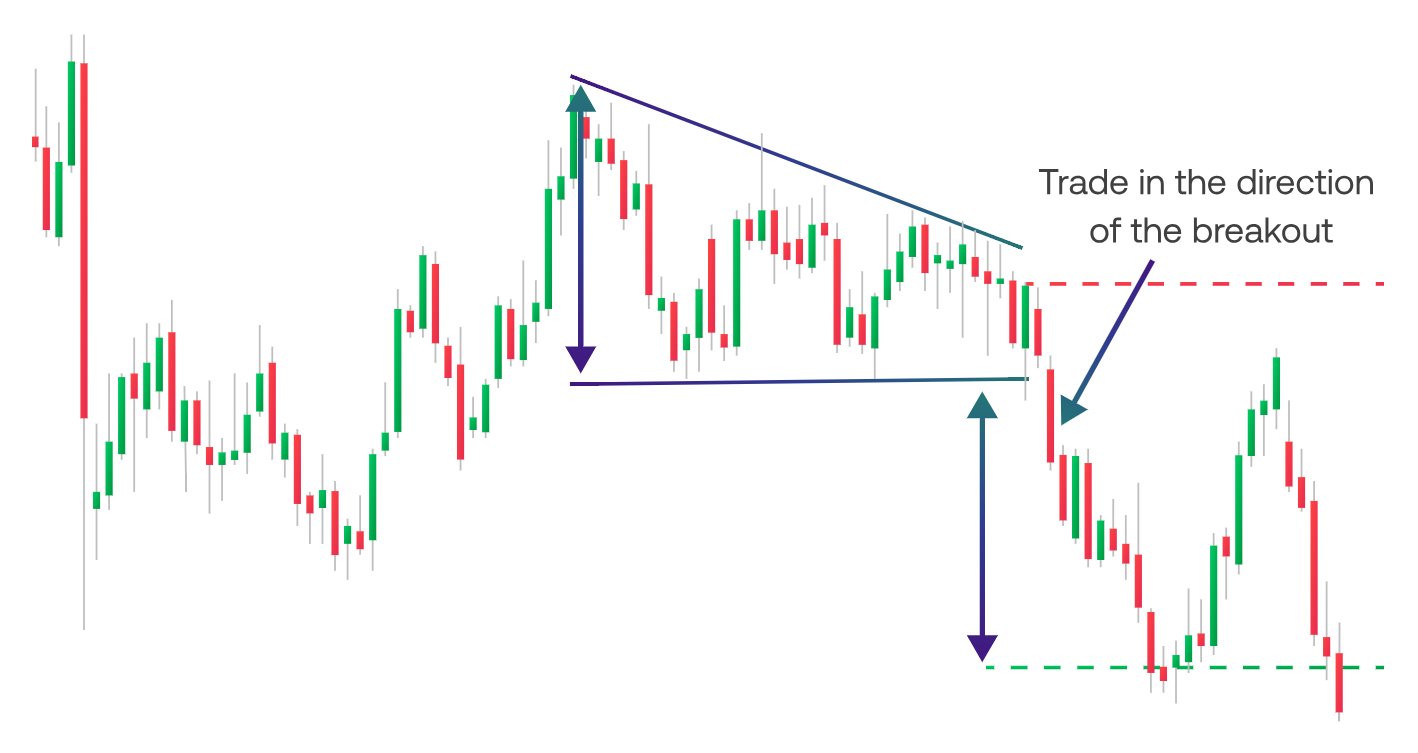
The descending triangle is the opposite of an ascending one. It usually occurs after a downtrend, and is formed when a horizontal set of lows (the support level) is met by a descending set of highs (resistance).
It’s also considered a continuation pattern, telling us that the market is likely to break out lower through the support level, making it a bearish signal. However, if the market breaks out through resistance instead, it may mean the beginning of a new uptrend.
As with its ascending counterpart, falling volume within the pattern followed by a spike as the market breaks out can make for a stronger signal.