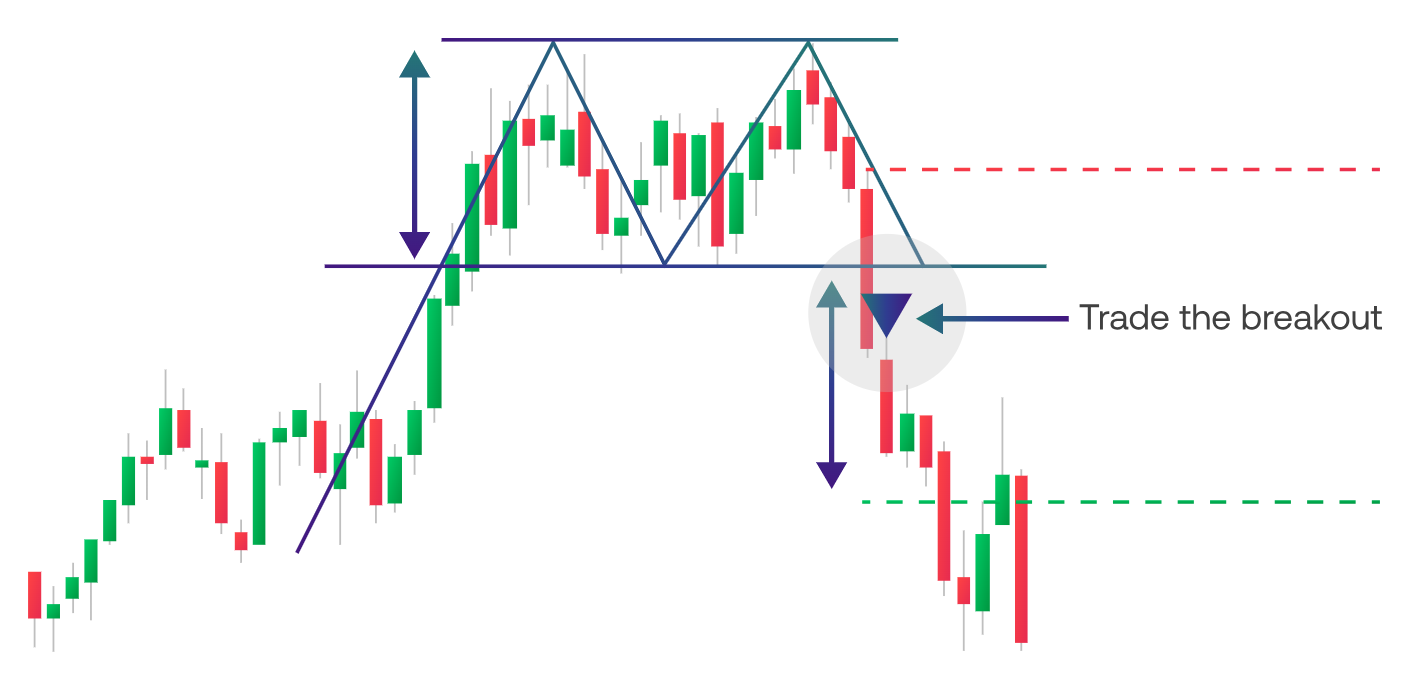
A double top pattern is formed after a market’s price reaches two highs consecutively with small declines in between. It forms an M-shape on a chart.
The double top is a bearish reversal pattern, so it’s thought that the asset’s price will fall below the support level that forms at the low point between the two highs. It’s crucial to confirm this support level, as basing your trade solely on the formation of the two peaks can cause a false reading.
In a double top, an upwardly trending market twice tries to hit new highs. But both times, it retraces as sellers drive the price back down – a sign that bullish momentum may be on the wane.
Often, the second top won’t be quite as high as the first, as it’s signaling the end of buying pressure.