Support and resistance levels are important points in time where the forces of supply and demand meet. These support and resistance levels are seen by technical analysts as crucial when determining market psychology and supply and demand. When these support or resistance levels are broken, the supply and demand forces that created these levels are assumed to have moved, in which case new levels of support and resistance will likely be established.
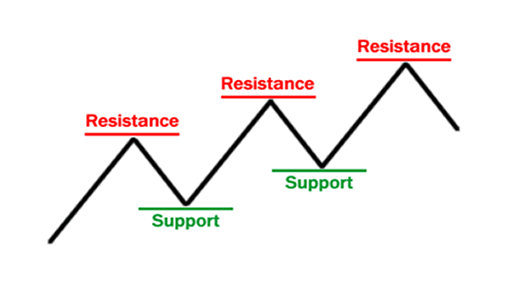
Support is the level at which demand is strong enough to stop the stock from falling any further. In the image above you can see that each time the price reaches the support level, it has difficulty penetrating that level. The rationale is that as the price drops and approaches support, buyers (demand) become more inclined to buy and sellers (supply) become less willing to sell.
Resistance is the level at which supply is strong enough to stop the stock from moving higher. In the image above you can see that each time the price reaches the resistance level, it has a hard time moving higher. The rationale is that as the price rises and approaches resistance, sellers (supply) become more inclined to sell and buyers (demand) become less willing to buy.
Let’s use a few examples of market participants to explain the psychology behind support and resistance.
First let’s assume there are buyers who’ve been buying a stock close to a support area. Let’s say that support level is Rs 100. They buy some stock at Rs 100 and now it moves up and away from that level to Rs 110. The buyers are happy and want to buy more stock at Rs 100, but not Rs 110. They decide if the price moves back down to Rs 100, they will buy more. They’re creating demand at the Rs 100 level.
Let’s take another group of investors. These are the people that were uncommitted. They were thinking about buying the stock at Rs 100 but never “pulled the trigger.” Now the stock is at Rs 110 and they regret not buying it. They decide that if it gets to Rs 100 again, they will not make the same mistake and they will buy the stock this time. This creates potential demand.
The third group bought the stock below Rs 100; let’s say they bought it at Rs 90. When the stock got to Rs 100, they sold their stock, only to watch it go to Rs 110. Now they want to re-establish their long positions and want to buy it back at the same price they sold it, Rs 100. They’ve changed their sentiment from sellers to buyers. They regret selling it and want to right that wrong. This creates more demand.
Now let’s change things up to help understand resistance. Take all the above participants and say they all own the stock at Rs 100. Imagine yourself as one of the owners at Rs 100. The stock goes to Rs 110 and you don’t sell. Now the stock goes back to Rs 100, where you own it. What are you feeling? Regret for not selling it at Rs 110? Now it goes back to Rs 110 and you sell as much as you can this time. So do the other owners of the stock. The stock can’t get past Rs 110 and retreats. There are at least 3 groups of stock owners that are trying to sell their supply at Rs 110. This creates a resistance level at Rs 110.
These are just a few examples of many possible scenarios. If you’ve traded before, you’ve probably been through all of these scenarios and experienced the emotions and psychology behind them. You’re not alone. There are countless market participants going through the same emotions and thought processes as you, and this is what helps determine some of the market psychology behind support and resistance, and technical analysis in general.