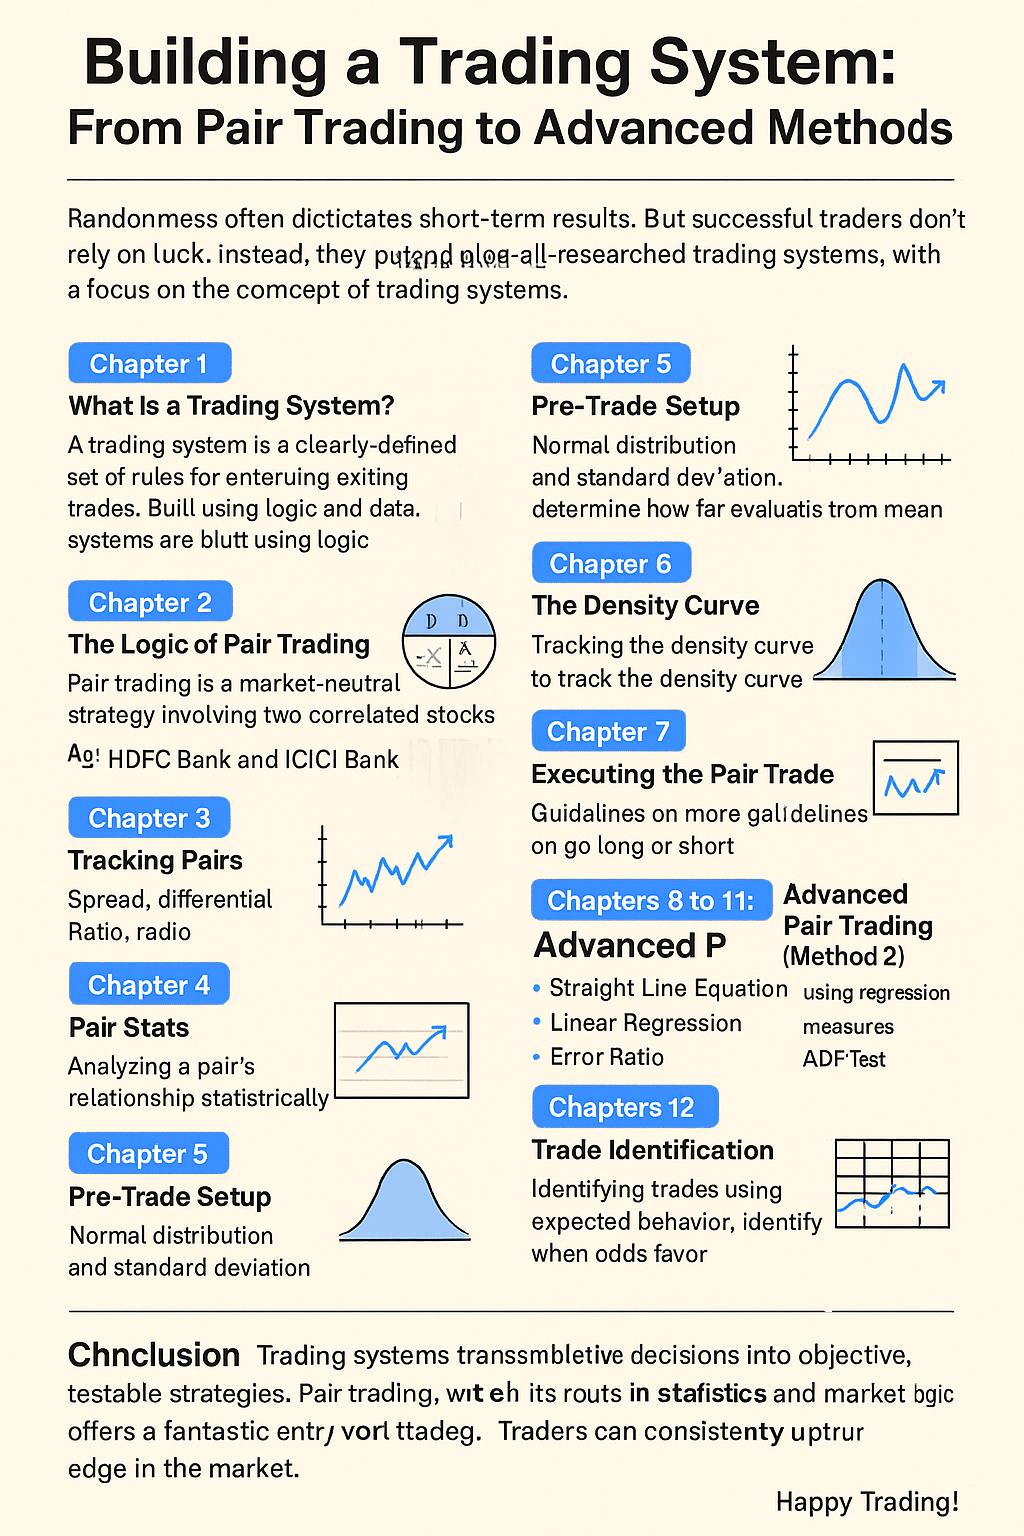
In the world of trading, randomness often dictates short-term results. But successful traders don’t rely on luck. Instead, they build well-researched trading systems that are objective, repeatable, and measurable. In this blog, we explore the concept of trading systems, with a focus on the popular "Pair Trading" strategy, and cover advanced methods including statistical tools and real-world case studies. Let’s get started on the path to structured trading success.
A trading system is a clearly defined set of rules for entering and exiting trades. Unlike emotional or speculative trading, systems are built using logic and data. Think of it as creating a machine that makes decisions based on predefined inputs. Systems help eliminate emotional errors, enforce discipline, and allow backtesting to assess their effectiveness before deploying real capital.
Trading systems are not magic bullets. They require monitoring, tweaking, and strict adherence. But once developed, they can turn trading into a scalable and consistent practice.
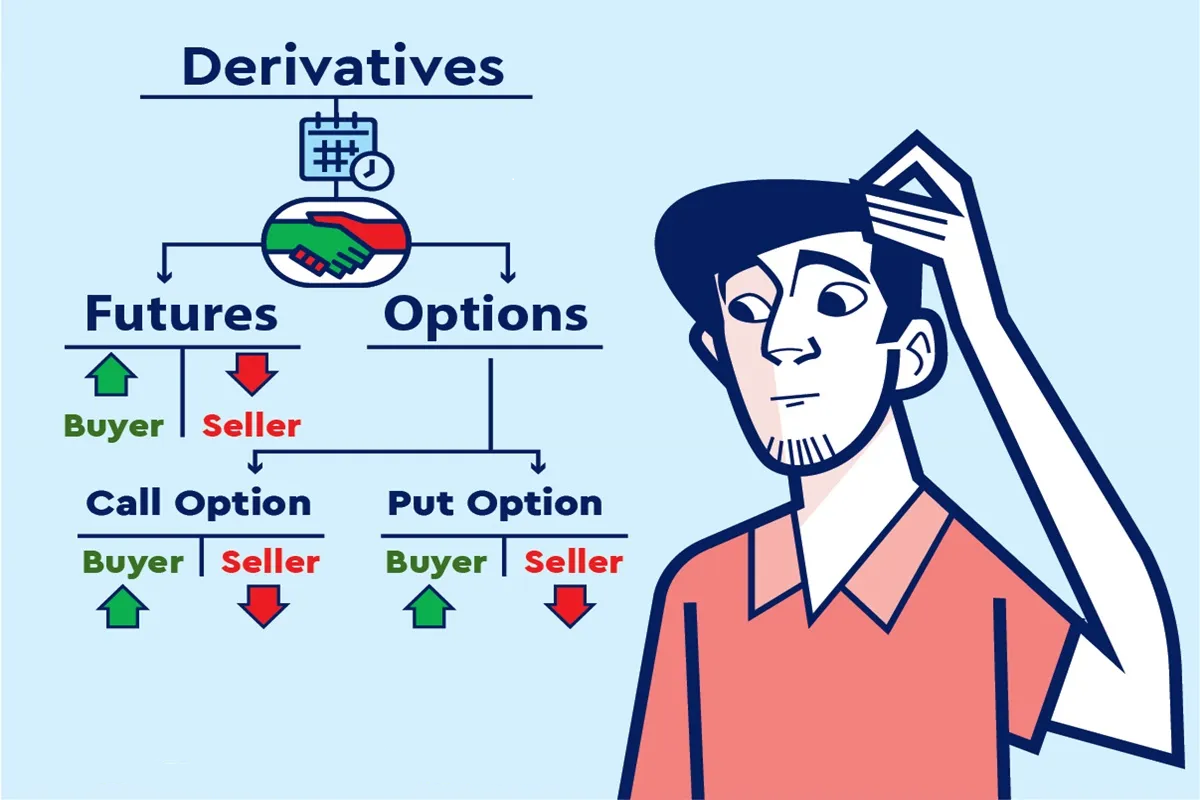
Pair trading is a market-neutral strategy involving two correlated stocks. The basic idea is simple: when two historically correlated stocks temporarily diverge in price, we short the outperformer and long the underperformer, expecting the relationship to revert.
Imagine HDFC Bank and ICICI Bank. They operate in similar environments, cater to similar customers, and often move together. If one suddenly shoots up while the other remains flat, a trader might short the one that surged and buy the one that lagged, assuming the gap will close.
This strategy thrives on the concept of mean reversion and is relatively immune to broader market direction.
To identify viable trading pairs, we need tools:
Spread: Difference in daily returns of two stocks
Differential: Difference in absolute stock prices
Ratio: Price of stock A divided by price of stock B
By tracking these metrics over time, we observe patterns and anomalies. For example, a widening spread may indicate a trading opportunity.
Another vital concept is correlation, which measures how closely two stocks move together. A correlation close to +1 indicates strong positive relation, essential for successful pair trading.
Once we have a pair, we analyze its relationship statistically. We use Excel to calculate:
Daily returns
Correlation (based on prices or returns)
Spread, differential, and ratio
We also calculate basic statistics like mean, median, and mode to understand the central tendencies of these variables.
This chapter introduces normal distribution and standard deviation, which help determine how far a stock's behavior is from its average.
We set up a standard deviation table for spread, differential, and ratio. When a value falls 2 or 3 standard deviations away from the mean, it could signal a high-probability trade.
A key refinement is tracking the density curve, which gives the probability of the variable reverting to the mean.
For example:
If the density value is 0.975, the ratio is far from the mean and has a high chance of mean reversion.
This helps traders stay disciplined and avoid false signals. Tools like Excel's NORM.DIST function make it easy to implement.
With all variables aligned, it’s time to trade. General guidelines:
Go long the ratio when density is between 0.003 and 0.025
Go short when density is between 0.975 and 0.997
Monitor the ratio daily, and exit as it reverts toward the mean. Use standard deviation zones as stop-loss and take-profit levels.
These chapters introduce a more statistical approach:
Straight Line Equation using regression
Linear Regression to model expected price
Error Ratio to measure deviation
ADF Test to ensure the relationship is stationary
These methods improve reliability by grounding decisions in mathematics.
Combining the previous methods, we can now identify trades with high confidence. This involves calculating expected behavior, identifying divergence, and acting when the odds favor reversion.
Chapter 13 & 14: Live Trade Examples
Real examples show how these techniques work in the market. Each trade highlights entry, rationale, risk control, and outcome. These are powerful learning tools for traders.
A new strategy that involves buying and selling futures contracts of the same stock with different expiry dates. It benefits from time decay and volatility changes.
Chapter 16: Momentum Portfolios
Here, traders build a portfolio of high-momentum stocks, aiming to ride the trend. Selection is based on performance metrics and relative strength.
Conclusion
Trading systems transform subjective decisions into objective, testable strategies. Pair trading, with its roots in statistics and market logic, offers a fantastic entry point. By combining discipline, data, and sound risk management, traders can consistently capture edge in the market.
Happy Trading!